
Performance tuning using Collect Statistics in Teradata table with examples
Contents
Collect Statistics in Teradata
Collect statistics statement is collects the demographic data for one or more columns ,hash indexes , join indexes of the table and stores the synopsis in the data dictionary. The Optimizer uses the synopsis data to generate the table access and join plans.
The statistics collected by Collect statistics
Data demographics include the below details
- Number of rows in the table
- Row size
- Number of unique values in the table
- Range values in a table
- Number of NULL’s for the columns
- Information of all indexes
Syntax for the Collect Statistics in Teradata
#1.Collect statistics for column
COLLECT STATISTICS
COLUMN (Column1,Column2,...) ON
     Database_Name.Table_Name;
#2.Collect statistics for Index
COLLECT STATISTICS
INDEX(Index_Column1,Index_Column2,....) ON
     Database_Name.Table_Name;
Example for collect statistics
Lets do the collect statistics for the customer table and it has the below records.
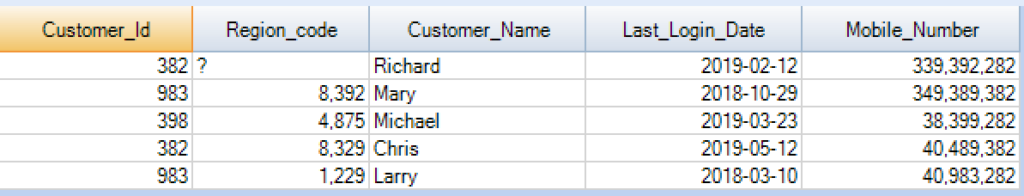
Now we are going to run the collect statistics statement for the columns Customer_Id and Region_code on the Customer table.
COLLECT STATISTICS COLUMN(Customer_Id,Region_code) ON BANKING_DB.CUSTOMER;View statistics of a table
Help stats statement is used to view the collected statistics of a table in Teradata.
Syntax of Help Stats statement
HELP STATS ON Database_Name.Table_Name;Example for the Help stats
HELP STATS ON Banking_DB.Customer;
To view the Optimizer suggestions in Teradata
Once we set the DIAGNOSTIC HELPSTATS, the optimizer will show the explain plan of the query which we are going to run in the Teradata. We can use this statement to check whether the stats are working well for a query.
Set the DIAGNOSTIC HELPSTATS
DIAGNOSTIC HELPSTATS ON FOR SESSION;Lets view the query plan using the Explain statement for the select query as below. It will give the stats collection recommendation that helps to improve the query performance.
EXPLAIN SELECT * FROM BANKING_DB.CUSTOMER;Output of the Explain statement
  1) First, we lock BANKING_DB.CUSTOMER in TD_MAP1 for read on a
     reserved RowHash to prevent global deadlock.
  2) Next, we lock BANKING_DB.CUSTOMER in TD_MAP1 for read.
  3) We do an all-AMPs RETRIEVE step in TD_MAP1 from
     BANKING_DB.CUSTOMER by way of an all-rows scan with no
     residual conditions into Spool 1 (group_amps), which is built
     locally on the AMPs.  The size of Spool 1 is estimated with high
     confidence to be 5 rows (285 bytes).  The estimated time for this
     step is 0.00 seconds.
  4) Finally, we send out an END TRANSACTION step to all AMPs involved
     in processing the request.
  -> The contents of Spool 1 are sent back to the user as the result of
     statement 1.  The total estimated time is 0.00 seconds.
Recommended Articles
- How to calculate the query execution time in Teradata?
- How to create or drop the secondary index in Teradata?
- How to check the table size using query in Teradata?